
I have looked for a way to monitor my servers in Home-Assistant, and I come across this monitoring-system called “Glances“. It is a cross-platform system that is possible to install on most operating systems, it is free and it has a open API.
It even has a integration in Home-Assistant, however this integration is a bit lacking. Because of this I have decided to drop it and acquire all data trough the REST API. I will show I have set this all up in this post.
I also made a interface in Lovelace.
Installation
Before doing anything in Home-Assistant you have to install Glances on the server(s) you want to monitor.
Here is a guide on how it can be installed on most Linux systems:
Glances: Installation and autostarting on Linux
RESTful Sensors
This is the RESTfull sensors I use to collect data. Replace 10.0.24.14 with the server’s IP
sensor.glances_server_uptime
This sensor will collect and present the server uptime.
sensor:
  - platform: rest
    name: Glances - SERVER - Uptime
    value_template: '{{ value_json }}'
    resource: http://10.0.24.14:61208/api/3/uptime
sensor.glances_server_cpu_temperature
This sensor will collect and present the server’s CPU temperature. This sensor might need to be tweaked if it is used in systems with multiple sensors.
sensor:
  - platform: rest
    name: Glances - SERVER - CPU - Temperature
    device_class: temperature
    unit_of_measurement: "°C"
    value_template: '{{ value_json[0].value }}'
    resource: http://10.0.24.14:61208/api/3/sensors
sensor.glances_server_disk
This sensor will collect file system data for the root share. Free Space, Used Space and Total Size will be stored as entity attributes. The sensor itself will just show “ok”.
sensor:
  - platform: rest
    resource: http://10.0.24.14:61208/api/3/fs
    name: Glances - SERVER - Disk
    value_template:  '{{ "ok" }}'
    json_attributes_path: '$[0]'
    json_attributes:
      - free
      - size
      - used
sensor.glances_server_ram
This sensor will collect memory stats. Free RAM, Used RAM and Total RAM Size will be stored as entity attributes. The sensor itself will just show “ok”.
sensor:
  - platform: rest
    resource: http://10.0.24.14:61208/api/3/mem
    name: Glances - SERVER - RAM
    value_template:  '{{ "ok" }}'
    json_attributes:
      - used
      - free
      - total
sensor.glances_server_cpu
This sensor will collect the current CPU utilization in percentage as a entity attribute. The Sensor itself will just show “ok”.
sensor:
  - platform: rest
    resource: http://10.0.24.14:61208/api/3/cpu
    name: Glances - SERVER - CPU
    value_template:  '{{ "ok" }}'
    json_attributes:
      - total
sensor.glances_server_cpu_process_glances
This sensor will collect information about a specified process, it will store process name, status, username and PID as entity attributes. The sensor itself will just show “ok”. Replace “glances” with the process. It is case-sensitive. Multiply this sensor (with different names) to collect status of multiple processes.
sensor:
  - platform: rest
    resource: http://10.0.24.14:61208/api/3/processlist
    name: Glances - SERVER - CPU - Process - glances
    value_template:  '{{ "ok" }}'
    json_attributes_path: '$..[?(@.name=="glances")]'
    json_attributes:
      - name
      - status
      - username
      - pid
Template Sensors
This is the Template sensors I use to re-format data from the REST Sensors.
sensor.glances_server_cpu_used_pct
This one will show CPU load in percent.
sensor:
  - platform: template
    sensors:
      glances_server_cpu_used_pct:
        friendly_name: "Glances - SERVER - CPU Used"
        unit_of_measurement: "%"
        value_template: '{{ state_attr("sensor.glances_server_cpu", "total") }}'
sensor.glances_server_ram_used_mb
This one will convert memory used (bytes) to memory used (megabytes) and remove the decimals.
sensor:
  - platform: template
    sensors:
      glances_server_ram_used_mb:
        friendly_name: "Glances - SERVER - RAM Used"
        unit_of_measurement: "MB"
        value_template: '{{ (state_attr("sensor.glances_server_ram", "used") | float / 1024/1024) | round(0) }}'
sensor.glances_server_ram_free_mb
This one will convert free memory (bytes) to free memory used (megabytes) and remove the decimals.
sensor:
  - platform: template
    sensors:
      glances_server_ram_free_mb:
        friendly_name: "Glances - SERVER - RAM Free"
        unit_of_measurement: "MB"
        value_template: '{{ (state_attr("sensor.glances_server_ram", "free") | float / 1024/1024) | round(0) }}'
sensor.glances_server_ram_total_mb
This one will convert total memory (bytes) to total memory used (megabytes) and remove the decimals.
sensor:
  - platform: template
    sensors:
      glances_server_ram_total_mb:
        friendly_name: "Glances - SERVER - RAM Total"
        unit_of_measurement: "MB"
        value_template: '{{ (state_attr("sensor.glances_server_ram", "total") | float / 1024/1024) | round(0) }}'
sensor.glances_server_disk_used_gb
This one will convert disk space used (bytes) to space used (gigabytes) and remove all but 2 decimals.
sensor:
  - platform: template
    sensors:
      glances_server_disk_used_gb:
        friendly_name: "Glances - SERVER - Disk Used"
        unit_of_measurement: "GB"
        value_template: '{{ (state_attr("sensor.glances_server_disk", "used") | float / 1024/1024/1024) | round(2) }}'
sensor.glances_server_disk_free_gb
This one will convert free disk space (bytes) to free space (gigabytes) and remove all but 2 decimals.
sensor:
  - platform: template
    sensors:
      glances_server_disk_free_gb:
        friendly_name: "Glances - SERVER - Disk Free"
        unit_of_measurement: "GB"
        value_template: '{{ (state_attr("sensor.glances_server_disk", "free") | float / 1024/1024/1024) | round(2) }}'
sensor.glances_server_disk_size_gb
This one will convert total disk space (bytes) to totalt space(gigabytes) and remove all but 2 decimals.
sensor:
  - platform: template
    sensors:
      glances_server_disk_size_gb:
        friendly_name: "Glances - SERVER - Disk Size"
        unit_of_measurement: "GB"
        value_template: '{{ (state_attr("sensor.glances_server_disk", "size") | float / 1024/1024/1024) | round(2) }}'
Lovelace
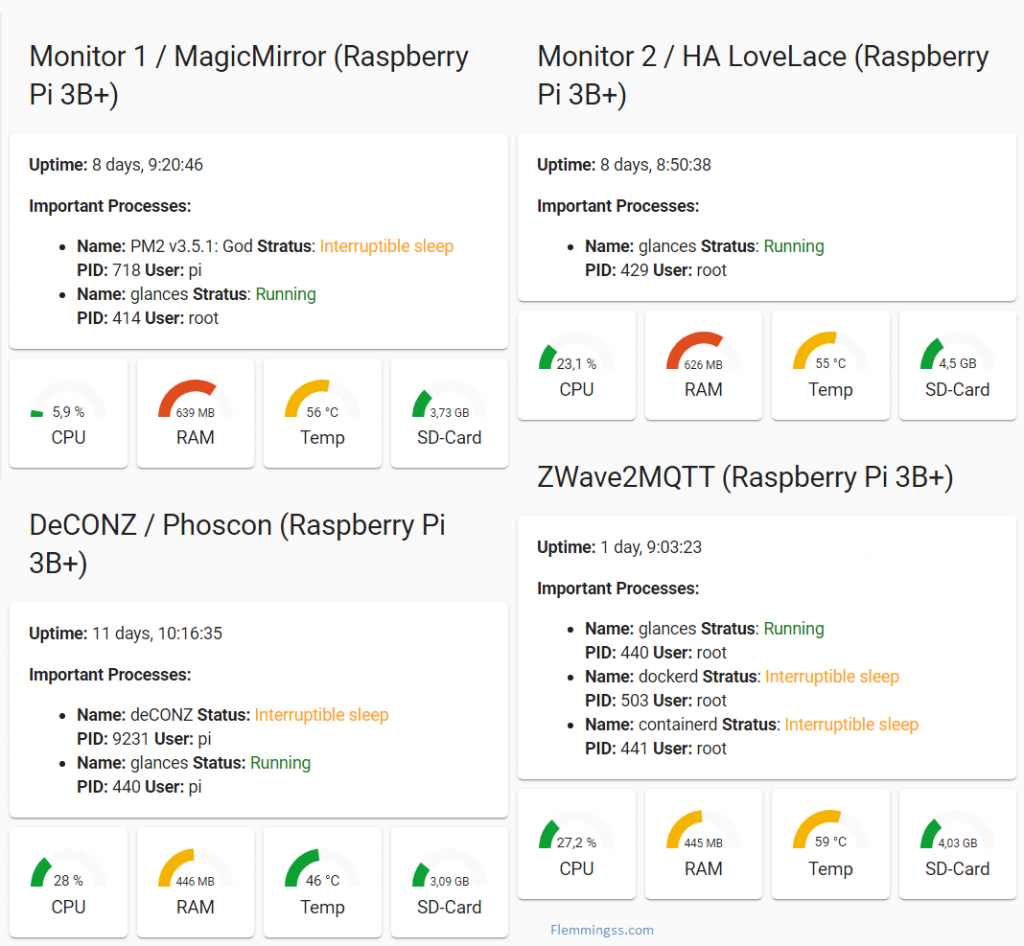
This is how each of my Lovelace cards is set up. One of these is used for each server. It has one Vertical Stack Card with a Markdown Card on the top, and a Horizontal Stack Card on the bottom. Inside the Horizontal Stack Card there is four Gauge Cards showing stats. Inside the Markdown Card it show uptime and process status. In this example it is showing the status of process “glances”.
The process status is converted from one-letter-status to more easy-to-read words with color codes.
R = Running
S = Interruptible sleep
D = Uninterruptible sleep
Z = Defunct process
T = Traced by job control signal
t = Stopped by debugger
X = Dead
*nothing* = Not Running
type: vertical-stack
title: Name for Server / Card
cards:
  - type: markdown
    content: >

      **Uptime:** {{ states("sensor.glances_server_uptime") }}


      <b>Important Processes:</b>

      * **Name:** {{
      states.sensor.glances_server_cpu_process_glances.attributes.name }}
      **Stratus**:  {% if
      states.sensor.glances_server_cpu_process_glances.attributes['status']
      == 'R' %} <font color="green">Running</font>{% elif
      states.sensor.glances_server_cpu_process_glances.attributes['status']
      == 'S' %} <font color="orange">Interruptible sleep</font>{% elif
      states.sensor.glances_server_cpu_process_glances.attributes['status']
      == 'D' %} <font color="red">Uninterruptible sleep</font>{% elif
      states.sensor.glances_server_cpu_process_glances.attributes['status']
      == 'Z' %} <font color="red">Defunct process</font>{% elif
      states.sensor.glances_server_cpu_process_glances.attributes['status']
      == 'T' %} <font color="red">Traced by job control signal</font>{% elif
      states.sensor.glances_server_cpu_process_glances.attributes['status']
      == 't' %} <font color="red">Stopped by debugger</font>{% elif
      states.sensor.glances_server_cpu_process_glances.attributes['status']
      == 'X' %} <font color="red">Dead</font>{% else %} <font color="red">Not
      Running</font> {% endif %}

      <b>PID: </b>{{
      states.sensor.glances_server_cpu_process_glances.attributes.pid }}
      <b>User:</b> {{
      states.sensor.glances_server_cpu_process_glances.attributes.username }}
  - type: horizontal-stack
    cards:
      - type: gauge
        min: 0
        max: 100
        entity: sensor.glances_server_cpu_used_pct
        name: CPU
        severity:
          green: 0
          yellow: 30
          red: 70
      - type: gauge
        entity: sensor.glances_server_ram_used_mb
        min: 0
        max: 926
        name: RAM
        severity:
          green: 0
          yellow: 300
          red: 600
        unit: MB
      - type: gauge
        min: 0
        max: 100
        severity:
          green: 0
          yellow: 50
          red: 80
        entity: sensor.glances_server_cpu_temperature
        name: Temp
      - type: gauge
        entity: sensor.glances_server_disk_used_gb
        min: 0
        max: 14.2
        severity:
          green: 0
          yellow: 7
          red: 12
        name: SD-Card
That’s it, I hope this little how-to will be helpful.
SOURCES
- https://github.com/nicolargo/glances/blob/master/README.rst
- https://selfhostedhome.com/monitor-your-systems-with-glances-and-home-assistant/
- https://community.home-assistant.io/t/template-on-restful-sensor/
- https://www.home-assistant.io/integrations/rest/#single-value-from-a-local-glances-instance
- https://www.home-assistant.io/integrations/glances/
- https://community.home-assistant.io/t/rest-sensor-where-x-equals-y/263852/3
- https://glances.readthedocs.io/en/stable/aoa/ps.html
- https://www.home-assistant.io/docs/configuration/templating/#home-assistant-template-extensions
- https://stackoverflow.com/questions/53980029/django-template-if-choice-field